Chữa đề mẫu IELTS Writing task 1: The table below gives information related to population growth, average birth per woman, life expectancy at birth in countries with different income levels in 2000 and 2004. Summarise the information making comparisons where relevant. Bài viết mẫu chữa đề thi thật IELTS ngày 11/3/2023.
Task 1: (Table) The table below gives information related to population growth, average birth per woman, life expectancy at birth in countries with different income levels in 2000 and 2004. Summarise the information making comparisons where relevant.
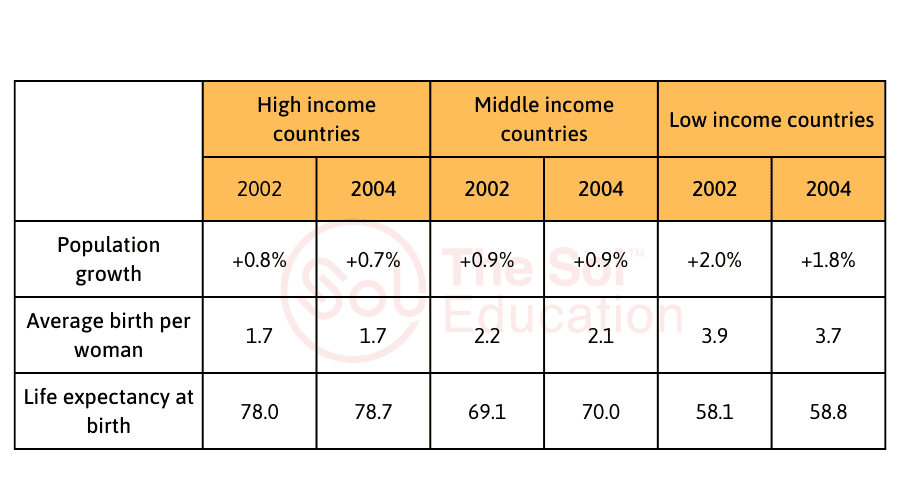
The table illustrates the growth of population, average fertility rate, and life expectancy at birth in nations with categorized income levels in 2002 and 2004. Overall, higher income countries experienced lower population growth and average birth per woman. Additionally, all nations witnessed an increase in life expectancy at birth for the period.
Regarding the population growth rate, high income countries witnessed a minimal drop from 0.8% in 2002 to 0.7% in 2004, while the figure for middle income nations experienced a plateau at 0.9%. Despite having the highest rate throughout the period, the percentage of low income countries dipped slightly from 2% in 2002 to 1.8% in 2004.
Concerning the fertility rate, female citizens from high income countries gave birth to an average of 1.7 infants in both years, which was the lowest. The statistics for middle and low income nations were 2.2 and 3.9 in 2002, respectively, after which they both decreased by around 0.1 in 2004.
Turning to life expectancy at birth, high income countries ranked first at 78 years old in 2002. The next highest data was middle income nations at 69.1, followed by low income countries at 58.1. In 2004, all countries saw an increase of approximately 0.8 in this category.
(216 words)