Trong bài viết này, The SOL sẽ cùng các bạn viết bài IELTS Writing task 1 dạng line graph với đề bài Percentage of Households nhé.
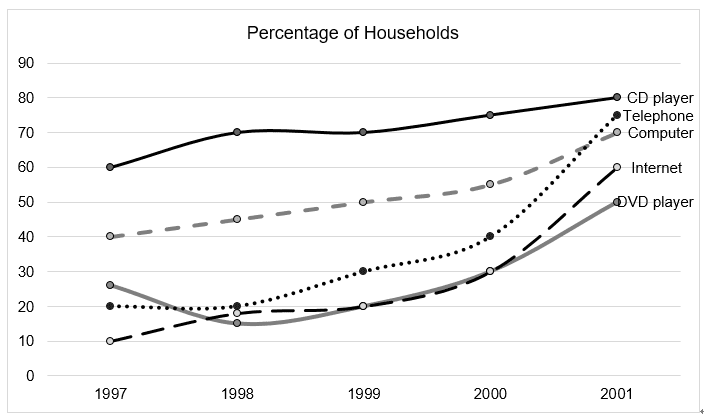
The graph below shows the percentage of households with different kinds of technology in the UK from 1997 to 2001.
Summarize the information by selecting and reporting the main features, and make comparisons where relevant.
- Biểu đồ cho thấy việc sử dụng công nghệ trong các hộ gia đình ở Anh vào cuối những năm 1990. Chúng ta cần tập trung vào việc mô tả xu hướng thay đổi tổng thể và mức độ của xu hướng trong biểu đồ.
- Lập dàn ý:
The table shows how many British households had access to different types of technology over a period of five years.
Overall, all the technologies became more popular during the period surveyed, although the most common item remained unchanged.
The most prevalent home devices experienced relatively modest changes. Topping the list were CD players, which were owned by 60% of households in 1997 and 80% five years later. In comparison, the percentages of households with a computer and a DVD player, the second and third largest (40% and 26%) in 1997, went up by 30% and 25%.
The remaining types of technology, although less common early on, rose more substantially in terms of popularity. The number of households with a telephone was relatively stable at around 20% from 1997 to 1998, but then experienced a sharp increase to 75% in 2001. Similarly, in 1997, only 10% of households had internet access, but this figure rapidly doubled and ultimately achieved a whopping 50% growth.
(163 words)
Chúc các bạn học IELTS Writing task 1 hiệu quả.