Đề thi IELTS Writing task 1 ngày 16/3 là dạng đề Cột chồng khá lạ với nhiều bạn. Chúng ta cùng chữa đề này để các bạn tham khảo cách viết nhé.
The chart below shows the percentage of a car manufacturer’s total sales in various regions from 2006 to 2010. Summarise the information by selecting and reporting the main features, and make comparisons where relevant.
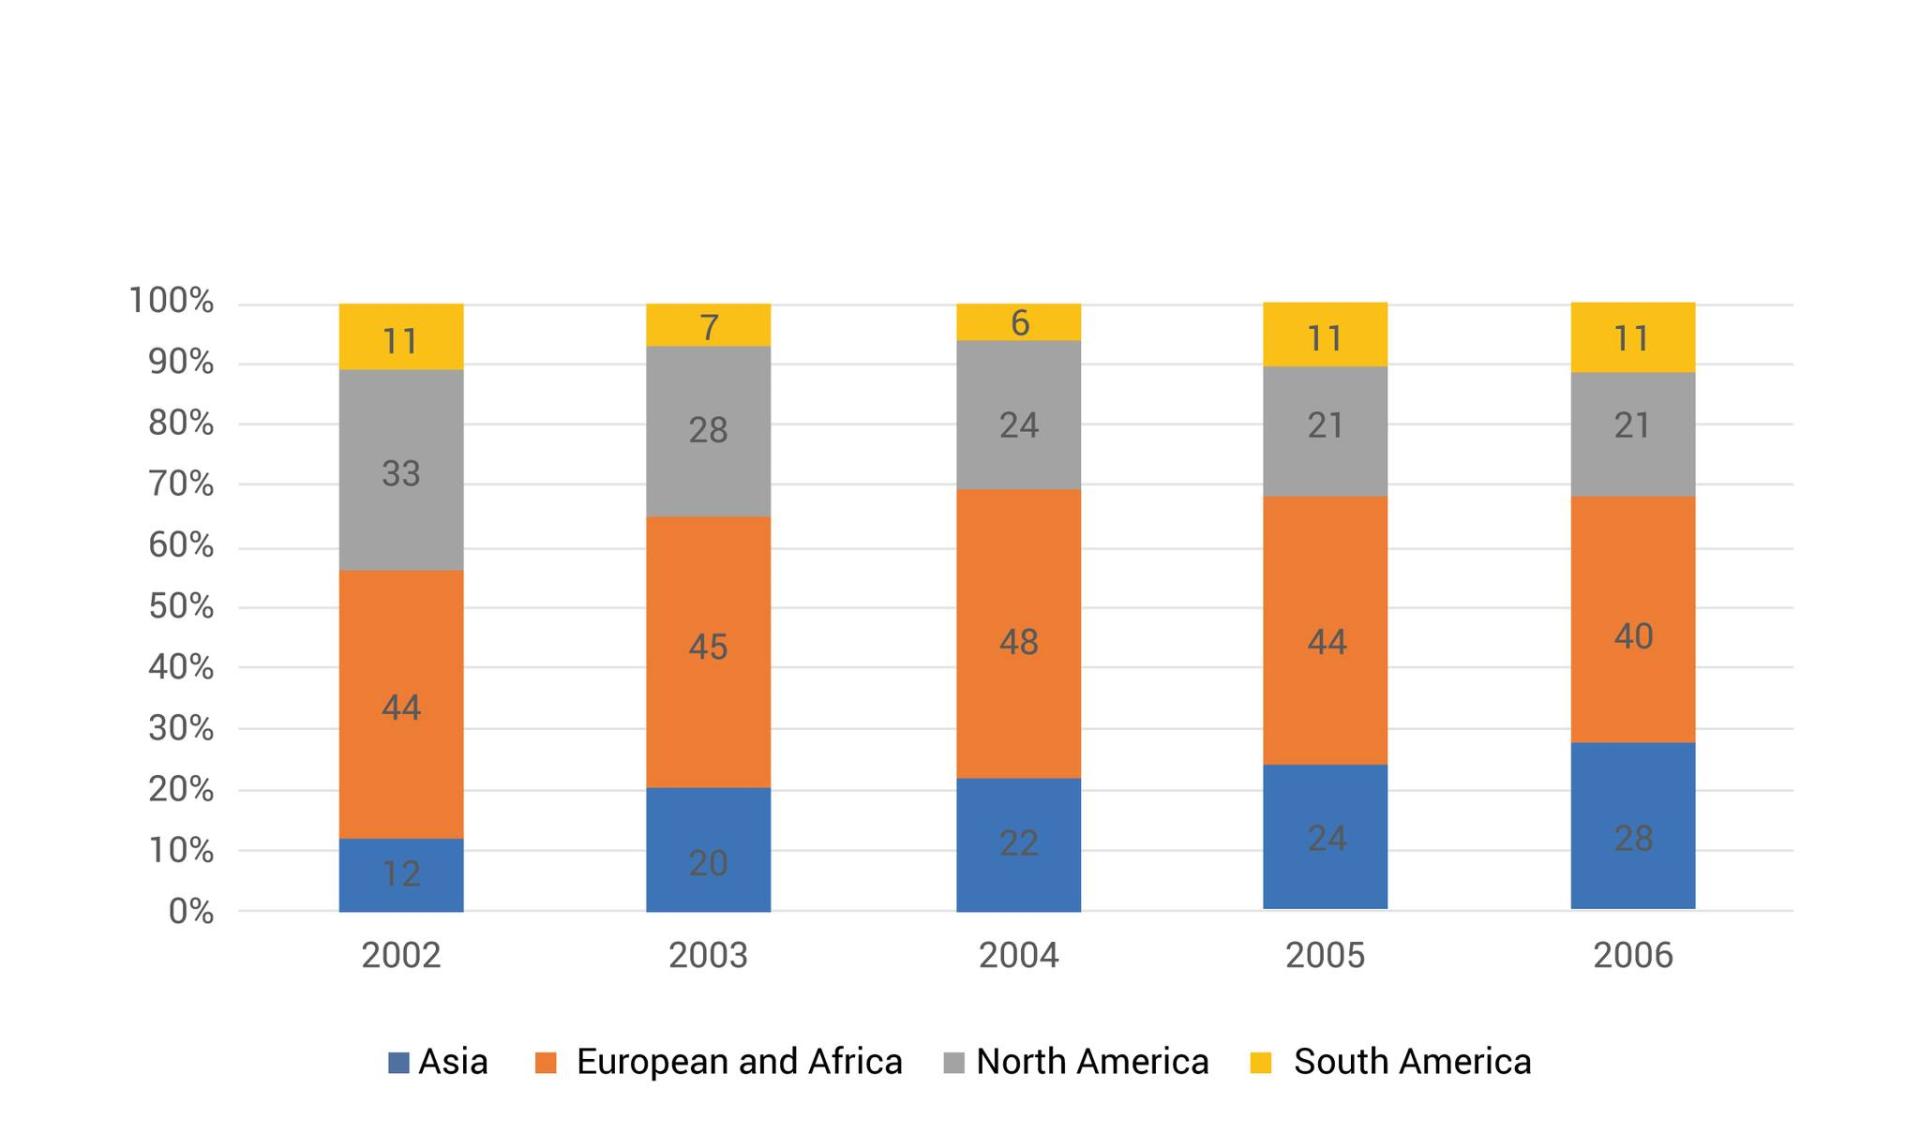
Với đề bài này, chúng ta cũng lập dàn ý gồm các phần như sau:
The provided bar chartillustrates the distribution of sales across various geographical regions for a car manufacturer during the period spanning from 2006 to 2010.
Overall, there was a significant surge in car sales in Asia, contrasting with a decline in North America, while Europe and South America experienced fluctuations. Initially, Europe held the largest market share, but Asia eventually surpassed it by the end of the period, becoming the primary market.
At the outset of the period, Europe dominated with 34% of total sales, which was three times higher than South America's share. North America and Asia followed closely behind, accounting for 30% and 25% respectively.
Subsequently, Asia experienced a remarkable increase in car sales, peaking at 50% by the end of the period, while North America witnessed a sharp decline, ending at 9%. Europe's sales figures saw a modest rise, reaching a high of 38% in 2008 before declining to 30% in 2010. In contrast, South America's figures declined to a low of 5% in 2009 but rebounded to 11% the following year.
(175 words)
Vocabulary:
geographical regions: khu vực địa lý
car manufacturer: nhà sản xuất ô tô
period spanning: khoảng thời gian trải dài
significant surge: sự tăng vọt đáng kể
decline: suy giảm
fluctuations: sự biến động
market share: thị phần
surpassed: vượt qua
dominated: chiếm ưu thế
total sales: tổng doanh số
accounting for: chiếm
remarkable increase: sự tăng trưởng đáng kể
peaking: đạt đỉnh
sharp decline: sự giảm mạnh
modest rise: sự gia tăng khiêm tốn
reaching a high of: đạt mức cao
declining: giảm
rebounded: phục hồi