Trong IELTS Writing Task 1, bảng biểu dạng tĩnh (static table) là một dạng bài yêu cầu thí sinh phân tích và so sánh số liệu tại một thời điểm cụ thể, không có sự thay đổi theo thời gian. Dạng này khiến nhiều thí sinh gặp khó khăn vì không biết cách chọn lọc thông tin cũng như bố cục bài viết. Trong bài viết này, SOL IELTS sẽ đưa ra những hướng dẫn siêu chi tiết giúp các bạn vượt qua dạng đề Table dạng tĩnh nhiều số liệu một cách dễ dàng, kèm những công thức dễ áp dụng. Hãy cùng đọc ngay nhé.
Đề bài mẫu: Trong bài viết này, chúng ta sẽ phân tích cách làm dựa trên đề bài mẫu dưới đây nhé:
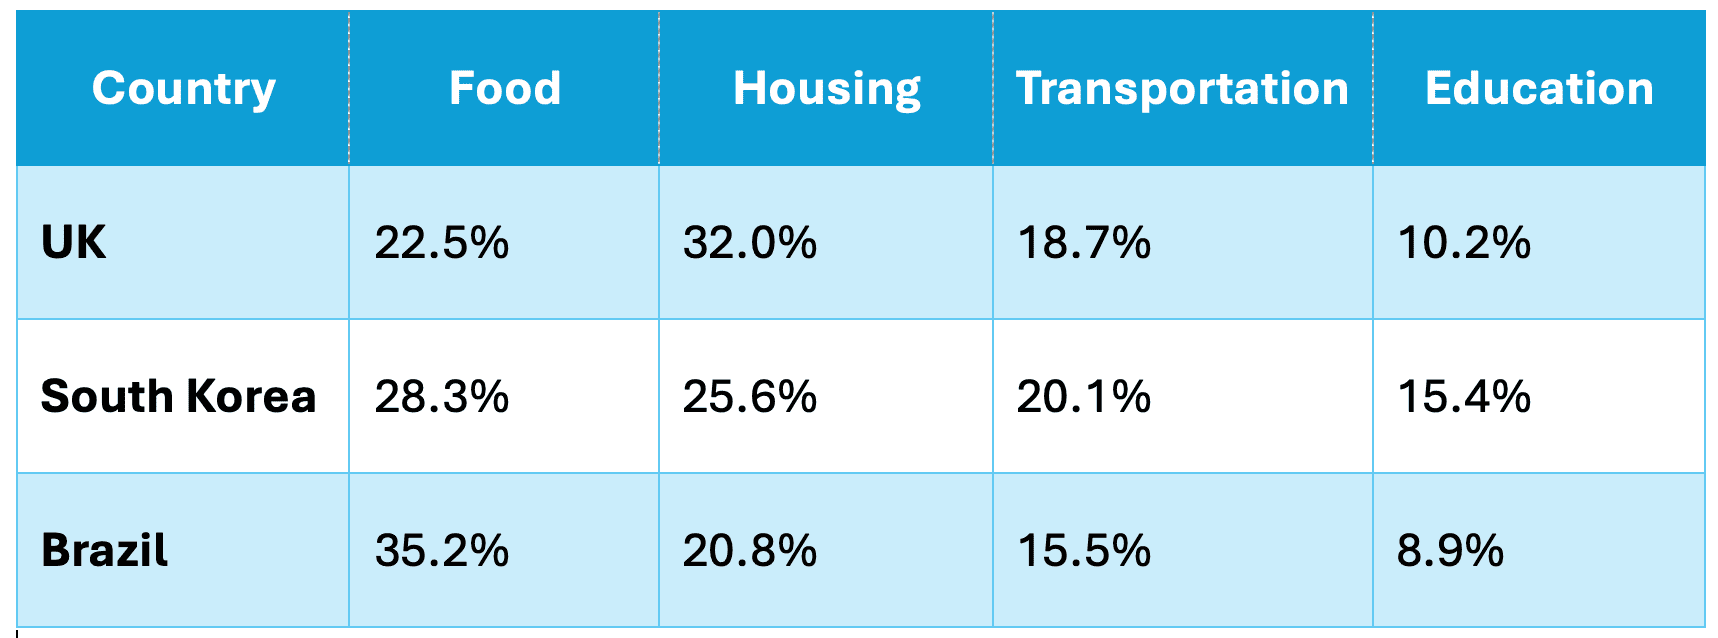
The table below shows the percentage of household expenditure on four categories – food, housing, transportation, and education – in three countries (the UK, South Korea, and Brazil) in 2021.
Bảng biểu dạng tĩnh cung cấp số liệu tại một mốc thời gian cố định, như tỷ lệ chi tiêu, dân số, hay sản lượng... Nhiệm vụ của chúng ta là tóm tắt thông tin chính, so sánh các đặc điểm nổi bật, và trình bày chúng một cách rõ ràng. Một trong những điểm mấu chốt mà các bạn cần nắm đó là là không so sánh các hạng mục trong cùng một quốc gia (ví dụ, không nói “người Brazil chi nhiều cho thực phẩm hơn giáo dục”), mà tập trung so sánh cùng một hạng mục giữa các quốc gia nhe.
Nếu được, các bạn nên dành khoảng 3-4/ tổng thời gian 20 phút để đọc bảng, ghi chú các con số cao nhất, thấp nhất hoặc bát thường. Điều này giúp chúng ta dễ dàng xác định xu hướng chính cho phần overview và dữ liệu có thể đưa vào phần Body
Một bài viết Task 1 dạng tĩnh cũng giống như bất kì bài Writing task 1 nào đều có bố cục gồm ba phần chính: Introduction, Overview, và Body Paragraphs. Dưới đây là hướng dẫn chi tiết viết Table dạng tĩnh mà các bạn hoàn toàn có thể áp dụng nhé.
Trong phần Introduction, mục tiêu của chúng ta là diễn đạt lại đề bài (paraphrase) một cách ngắn gọn, học thuật, và tự nhiên, nêu rõ bảng biểu nói về gì, tại thời điểm nào, và bao gồm những quốc gia hay hạng mục nào.
Với đề bài mẫu được đưa ra, chúng ta có thể phân tích như sau:
Công thức tham khảo:
The table + [verb: illustrates/presents/provides information on] + the proportion/percentage of + [metric: household expenditure/spending] + allocated to/devoted to + [categories] + in + [groups: countries/areas] + in + [time].
Viết Introduction:
Ta có Introduction hoàn chỉnh:
The table illustrates the proportion of spending by households on four categories, namely food, housing, transportation, and education, in the UK, South Korea, and Brazil in 2021.
Một trong những điều các bạn cần lưu ý khi viết introduction:
Trong phần overview, bạn hãy tóm tắt 2-3 xu hướng hoặc đặc điểm nổi bật nhất của bảng, không đi vào chi tiết số liệu nhé. Phần này giúp giám khảo hiểu ngay bức tranh tổng thể của dữ liệu.
Phân tích đề bài mẫu:
Và dưới đây là công thức mà các bạn có thể tham khảo để viết overview nè:
Overall, + [category A] accounted for/constituted the largest share/proportion of + [metric: spending] in + [group: most/all countries], with + [group X] recording the highest figure. In contrast/Conversely, + [category B] consistently represented the smallest proportion/share.
Rồi, với đề bài trên, chúng ta có thể chọn 2 xu hướng chính: Nhà ở và thực phẩm là hai hạng mục chi tiêu lớn nhất ở cả ba quốc gia; Giáo dục chiếm tỷ lệ nhỏ nhất ở hầu hết các quốc gia, với Hàn Quốc là ngoại lệ (cao nhất cho giáo dục). Và sau đó, nhấn mạnh quốc gia nổi bật: Brazil (thực phẩm), Anh (nhà ở).
Ta có phần overview hoàn chỉnh:
Overall, housing and food constituted the largest shares of household spending across all three countries, with the UK and Brazil recording the highest figures for housing and food, respectively. In contrast, education consistently accounted for the smallest proportion, except in South Korea, where it was notably higher.
Những điều cần lưu ý khi viết overview:
Với phần Body (thân bài), nhiệm vụ của chúng ta là trình bày chi tiết số liệu, so sánh các quốc gia theo từng hạng mục, làm nổi bật sự khác biệt hoặc điểm đặc biệt. Với phần này, thông thường chúng ta sẽ viết 2 đoạn, tuy nhiên bạn vẫn có thể viết thành 3-4 đoạn nếu cần thiết hoặc đủ khả năng. Tuy nhiên SOL thấy 2 đoạn là an toàn nhất rùi nè.
Phân tích đề bài mẫu:
Xem ngay 2 công thức gợi ý dưới đây nha:
[Category A] accounted for/constituted a significant proportion of + [metric] in + [group: all/most countries]. [Group X] recorded the highest figure, at + [figure], followed by + [group Y] with + [figure]. In contrast/Meanwhile, + [group Z] allocated a lower share, at + [figure]. Similarly/Regarding [Category B], + [group X] again led with + [figure], while + [group Y] and [group Z] recorded + [figures], respectively.
Turning to the remaining categories, + [category C] saw varied levels of expenditure. [Group X] devoted the largest share, at + [figure], whereas + [group Y] and [group Z] allocated + [figures]. Meanwhile/On the other hand, + [category D] received the least attention, with figures ranging from + [figure] in + [group Z] to + [figure] in + [group X].
Rồi, bây giờ ta sẽ bắt tay vào viết Body cho bài viết của chúng mình nhé:
Body Paragraph 1:
Ví dụ:
Housing and food accounted for the most significant proportions of household expenditure in all three countries. In terms of housing, the UK allocated the largest share, at 32.0%, followed by South Korea with 25.6%, while Brazil devoted a notably lower proportion, at 20.8%. In contrast, food expenditure was highest in Brazil, at 35.2%, significantly surpassing South Korea’s 28.3% and the UK’s 22.5%.
Body Paragraph 2:
Ví dụ:
Turning to the remaining categories, transportation and education represented smaller shares of household budgets. South Korea recorded the highest expenditure on transportation, at 20.1%, followed closely by the UK at 18.7%, whereas Brazil allocated the least, at 15.5%. On the other hand, education saw the most significant variation, with South Korea devoting a substantial 15.4%, compared to 10.2% in the UK and only 8.9% in Brazil.
Đừng quên lưu ý những điểm sau khi viết Body cho dạng bài số liệu tĩnh trong Writing task 1 nè:
Tổng kết lại, ta có một sample cho đề bài mẫu được đưa ra như sau:
The table illustrates the proportion of spending by households on four categories, namely food, housing, transportation, and education, in the UK, South Korea, and Brazil in 2021.
Overall, housing and food constituted the largest shares of household spending across all three countries, with the UK and Brazil recording the highest figures for housing and food, respectively. In contrast, education consistently accounted for the smallest proportion, except in South Korea, where it was notably higher.
Housing and food accounted for the most significant proportions of household expenditure in all three countries. In terms of housing, the UK allocated the largest share, at 32.0%, followed by South Korea with 25.6%, while Brazil devoted a notably lower proportion, at 20.8%. In contrast, food expenditure was highest in Brazil, at 35.2%, significantly surpassing South Korea’s 28.3% and the UK’s 22.5%.
Turning to the remaining categories, transportation and education represented smaller shares of household budgets. South Korea recorded the highest expenditure on transportation, at 20.1%, followed closely by the UK at 18.7%, whereas Brazil allocated the least, at 15.5%. On the other hand, education saw the most significant variation, with South Korea devoting a substantial 15.4%, compared to 10.2% in the UK and only 8.9% in Brazil.
Trên thực tế, có khá nhiều bạn gặp sai sót khi sử dụng ngôn ngữ và cách diễn đạt cho bài viết Task 1 về Table với số liệu tĩnh. Để viết chính xác và tự nhiên, hãy chú ý chủ ngữ của câu nhé. Như trong đề bài trên thì số liệu phản ánh hành vi của con người (hộ gia đình, người dân), không phải quốc gia. Nên nếu bạn viết "The UK spent 32.0% on housing." là chưa chính xác. Chúng ta phải viết đúng là "Households in the UK allocated 32.0% of their expenditure to housing." nhe các bạn.
Ngoài ra, bạn có thể sử dụng các cụm như “allocated to”, “devoted to”, “accounted for” để diễn đạt hành động chi tiêu.
SOL tặng các bạn 4 mẫu câu hữu ích nè:
Bên cạnh đó, sử dụng từ nối cũng là một yếu tố quan trọng giúp bài viết của bạn đảm bảo tính logic, mạch lạc - một trong 4 tiêu chí của bài viết IELTS. Dưới đây là một số từ nối mà các bạn có thể sử dụng để diễn đạt sự so sánh, chuyển ý hay nhấn mạnh:
Khi luyện viết IELTS Writing task 1 dạng table số liệu tĩnh, có một số điều mà SOL muốn các bạn luyện đó là cân đối thời gian sao cho hợp lý. Với 20 phút làm bài, chúng ta có thể phân chia thời gian như sau:
Hãy luyện tập với nhiều bảng số liệu khác nhau để quen với cách so sánh, lựa chọn dữ liệu nha
Bây giờ hãy thử luyện tập với đề bài dưới đây nhé:
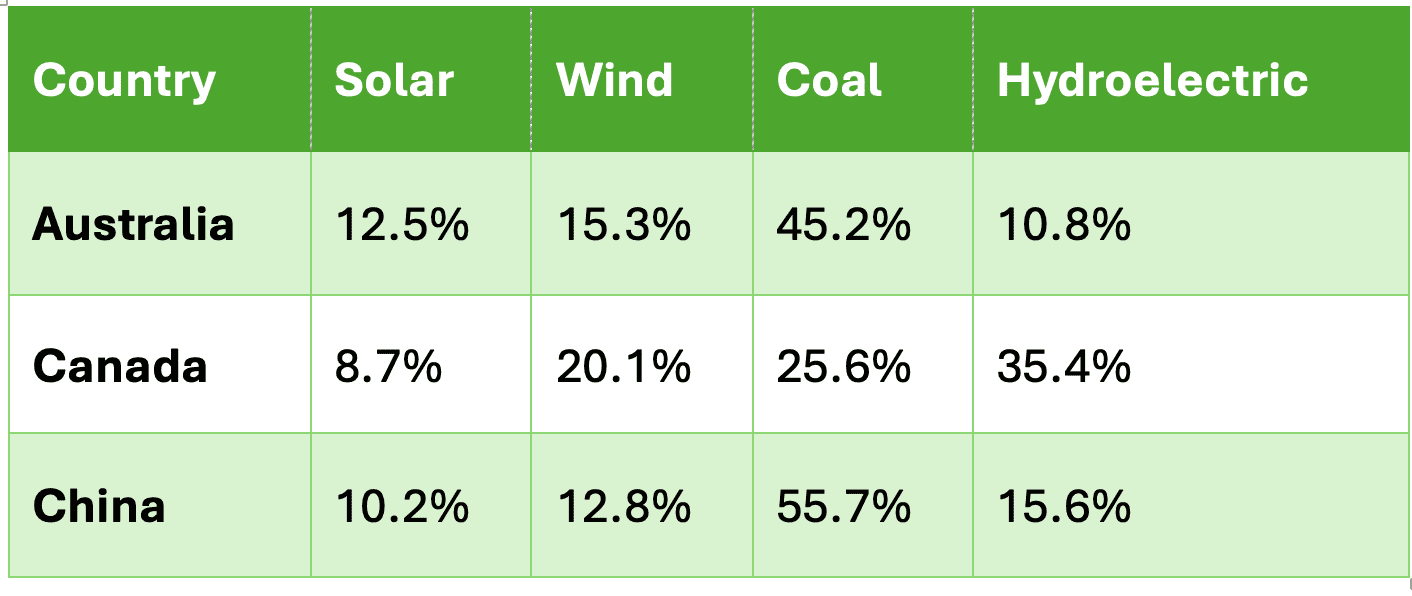
The table below shows the percentage of energy consumption from four sources – solar, wind, coal, and hydroelectric – in three countries (Australia, Canada, and China) in 2022.
 Với đề bài này, chúng ta sẽ đi theo từng bước và cấu trúc trên và có được bố cục bài viết như sau:
The table presents the proportion of energy consumption derived from four sources – solar, wind, coal, and hydroelectric – in Australia, Canada, and China in 2022.
Overall, coal accounted for the largest share of energy consumption in Australia and China, while hydroelectric power dominated in Canada. Conversely, solar energy consistently represented the smallest proportion across all three countries.
Sample hoàn chỉnh:
The table presents the proportion of energy consumption derived from four sources – solar, wind, coal, and hydroelectric – in Australia, Canada, and China in 2022.
Overall, coal accounted for the largest share of energy consumption in Australia and China, while hydroelectric power dominated in Canada. Conversely, solar energy consistently represented the smallest proportion across all three countries.
Coal and hydroelectric power were the most significant sources of energy in the three countries. China relied heavily on coal, with 55.7% of its energy consumption, followed by Australia at 45.2%, whereas Canada recorded a considerably lower share, at 25.6%. In contrast, hydroelectric power was the dominant source in Canada, constituting 35.4%, significantly higher than China’s 15.6% and Australia’s 10.8%.
Turning to the remaining sources, wind and solar energy accounted for smaller proportions. Canada led in wind energy consumption, at 20.1%, followed by Australia with 15.3%, while China recorded the lowest share, at 12.8%. Meanwhile, solar energy saw the least usage, with Australia devoting the highest proportion, at 12.5%, compared to 10.2% in China and only 8.7% in Canada.
Table là một đạng được đánh giá là khá dễ viết trong IELTS Writing task 1, nhưng biết cách chọn lọc số liệu và viết để đạt band điểm cao lại là một điều cần lưu ý. Với các biểu đồ dạng tĩnh, cần sự tập trung vào việc chọn lọc thông tin và tổ chức bài viết hợp lý. Hy vọng các bạn có thể áp dụng những chia sẻ của SOL để viết được một bài viết đạt band điểm cao nhé.
Chúc bạn thành công.