The graph below shows people’s level of satisfaction with the health care system in 4 countries between 1991 and 2007
Summarise the information by selecting and reporting the main features, and make comparisons where relevant.
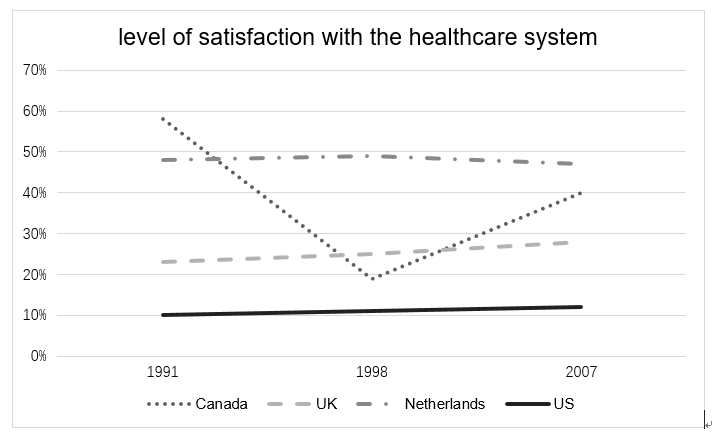
Phân tích đề: Biểu đồ thể hiện sự thay đổi về mức độ hài lòng của người dân đối với hệ thống y tế ở bốn quốc gia. Có thể thấy những thay đổi ở Canada là rõ ràng nhất, trong khi 3 quốc gia còn lại không có thay đổi gì đáng kể. Xét về số lượng, giá trị của Canada lúc đầu lớn nhất, nhưng sau đó bị Hà Lan vượt qua, trong khi Hoa Kỳ có giá trị thấp nhất.
The line graph illustrates the degree of contentment with the healthcare system in four countries (Canada, UK, Netherlands, and the US) from 1991 to 2007.
Overall, there was little variation in the level of satisfaction in each country, except for Canada, which experienced a significant dip and lost its top position to the Netherlands as the country with the most satisfying healthcare system.
In the initial years, Canada had the highest level of satisfaction, starting at 55%. However, this figure sharply plummeted to approximately 20% in 1998. Subsequently, there was a slight improvement, with the percentage rising to 40%, but still lower than the initial level.
On the other hand, the other three countries (UK, Netherlands, and the US) showed relatively stable trends throughout the period. The satisfaction levels in the UK and the Netherlands remained almost flat over the years, with the Netherlands consistently having a higher satisfaction rate of nearly 50%, surpassing Canada in 1993. The US, however, had the, starting at only 10% and maintaining a slightly higher but still low rate throughout the 17 years.
(181 words)
Dưới đây là một số từ vựng hữu ích trong bài viết trên:
Chúc các bạn học hiệu quả.